Blocks for everyone. 6 useful segments for you
- owwwla
- Feb 11, 2022
- 10 min read
This article complements previous posts on creating a persona and engaging with audiences in Google Analytics. If you didn't have an opportunity to read them so far, have a look here: Why my audience is the Persona? and How to create your hero (which Analytics will help with).
Example configuration were prepared using Universal Analytics.
As you already know, segments are useful to understand your audience and to test whether your imagination about what they are doing on your site makes sense. By reading this article, you will learn about segments, what maybe also inspire you to further "creativity". If you are already looking for specific solutions, go directly to the part you are interested in.
What are the segments?
Let's start from the beginning. According to Google documentation:
„A segment is a subset of your Analytics data. For example, of your entire set of users, one segment might be users from a particular country or city. Another segment might be users who purchase a particular line of products or who visit a specific part of your site.”
In practice, this means that you define the characteristics of the target group of recipients you are interested in, and from all data collected in one Analytics view, those meeting the given conditions are selected. Or you can imagine it as a kind of strainer with holes of a certain shape. Only those that pass through the strainer selected by you will fall into the prepared bucket-
segment.
Note: In this article, I only cover user segments. If you are interested in conversion segments, please see the Google documentation (link below the article).
Segment limits
As with everything, you can also create a limited number of segments. Fortunately, the limits are high so you don't have to worry about them too much. However, they depend on how you share the segments, so I'll put this information here.
If segments are set to be available to one user in each Universal Analytics data view, then there can be 1000. (Segment Availability: I can apply / edit a segment in each data view.)
If segments are only available to one user in only one data view, there can be a maximum of 100. (Segment availability: I can apply / edit a segment in this data view.)
If segments are available to all users in only one data view, there can be a maximum of 100. (Segment availability: Colleagues and I can apply / edit a segment in that data view.)
The maximum date range for user-based segments (which is all discussed here) is 93 days. If you choose a longer period, it will be automatically reduced to 93 days.
Also, note that you won't apply segments to your Google Ads cost reports or Multi Channel Funnel reports. For the latter, you will need conversion segments (link below the article).
What do we use segments for
Now that you know what segments are and how many you can create, it is still worth knowing what they will be used for. Segments as subsets are used to compare data to other parts of the dataset or to the whole. In practice, it looks like you enter the report, for example, Behavior > Site Content > All Pages, and for example, Logged In Users in the All Users segment, which is shown by default. The report updates and shows you data for both audiences, and you can see how active the logged in users were and whether they made multiple conversions and what kind. You can see which pages were viewed by them most often, how long sessions lasted and whether the bounce rate is at a satisfactory level.
You can use up to four segments in one report at once, and when you move on to the next report, the segments will stay in use. They will not disappear until you disable them or exit Analytics.
Segments useful for you
Now let's move on to the examples. Below you will find the configuration and how-to-use descriptions of the five segments that will be useful to you.
1. Persona segment
If you already have your persona (or a few) then create an "Analytics image" of it. I will use a persona named Daan, which was created in the article How to create your hero (which Analytics will help with) for Monika, a Norwegian language teacher. Let's start with how to "translate" the data from the persona into the segment settigns.
Age: 30 => Demographics > Age 24-34
Gender: male => Demographics > Male gender
Location: Rotterdam (The Netherlands) => Demographics > Location Netherlands (or the city of Rotterdam)
Language: English => Demographics > Language includes en
Profession: architect
Income: EUR 75,000 / year
Interests: contemporary architecture, mountain tourism
Values: openness to cultural diversity, freedom of travel

How to create such a segment?
Go to Admin > (right column) View > Segments > + ADD NEW SEGMENT
From the left menu choose Demographics and select all conditions in the middle, i.e. age, gender, language, and location.
In the right column you will see a summary of all selected conditions. It is especially useful when you select them from different categories, such as Demographics and Behaviour, and you may not be able to see all selected items at the same time.
Name the segment and save it.
Daan's "Analytics Image" is ready to use!
You can check whether "Daan" appears in reports, whether it uses mobile devices more often or prefers desktop, what pages it displays and how often it returns.
Are there many people in your reports matching your persona?
2. Segment of users from social media
Of course, you don't have to limit yourself to social media. In this way, you can also set up a segment of users coming in from other sources, for example branded media or paid advertising ("cpc" medium).

Go to Admin > (right column) View > Segments > + NEW SEGMENT
From the left-hand menu, select Advanced > Conditions, and in the middle, select Filter - Sessions - Include. Then select Source - Contains - facebook and click on the "OR" button on the right. In the next row, enter the name of the next social media. Keep adding rows as long as you keep adding one source at a time.
Note: Enter the sources names in lowercase because the source is taken from the URL, so it will be facebook, linkedin and tiktok, not Facebook, LinkedIn and TikTok. Additionally, Analytics will suggest source names based on the data already collected, but you don't need to enter m.facebook.com, l.facebook.com, and lm.facebook.com separately. Since the condition is set to "source contains", only one specific fragment of the address is enough for Analytics to catch them all. Therefore, "facebook".
Yes, you can also create a separate segment for each of these sources and compare them with each other.
Name the segment and save it.
Ready!
By using this segment, you can see how your social media activities impact your website traffic. However, remember that there is no traffic from Messenger or other communicators in them. If someone shared a link to your www in a private message, it will fall in as direct input (direct / none).
3. Segment that excludes spam
Sometimes your reports show up on page addresses that don't exist on your site? This is bot spam. Here's what we do with spam already registered in the data.
This time we will enter differently, directly from the report.
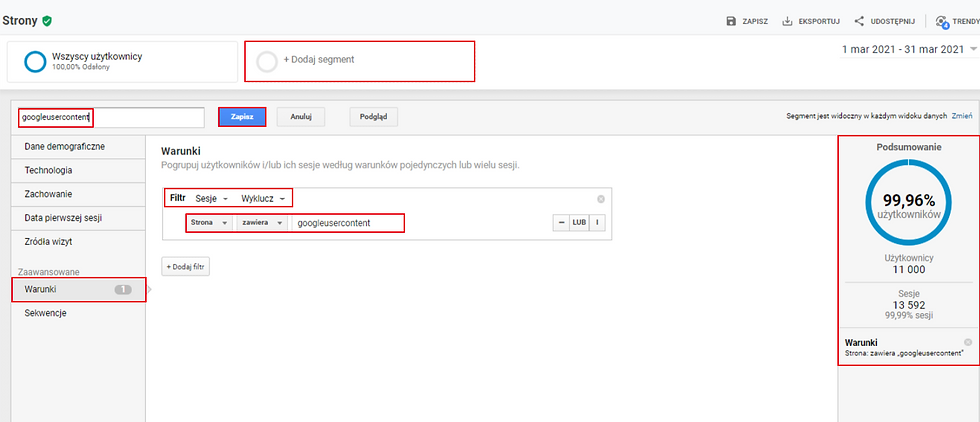
Go to report Behaviour > Site content > All pages. Click +Add segment > Click +NEW SEGMENT and choose Advanced > Conditions.
In the filter settings, change "Include" to "Exclude", then click the button with the inscription "Event action", and when the list expands, find "Page" (not "Search landing page" or "Exit page"). Entry side "is excluded 😉). Paste a fragment of the spamming address from your reports into the empty window, e.g. googleusercontent, as in my example.
As a bonus, you have information in the right column about the percentage of data from this report that covers the segment you are currently creating 😊
Name the segment and save it. When you come back to the table with the segment list, click "Apply". Then you automatically return to the report with the segments All users and spam spam turned on. You can turn off the first one to only look at valid data. We turn it off by clicking on the down arrow in the upper right corner of the segment.

Of course, spam should be excluded from traffic at all, but this segment will be useful for you to view and analyze the data that has already been collected. With it, you can work without worrying about how spammy traffic has corrupted your reports.
4. Logged in users segment
To create this segment, you must first let Analytics know what your users did to be considered logged in. For this, you will need to create a goal. Let it be, for example, clicking on "Log in".(If you don't know how to set up an event goal let me know - I will be happy to help – find me here).
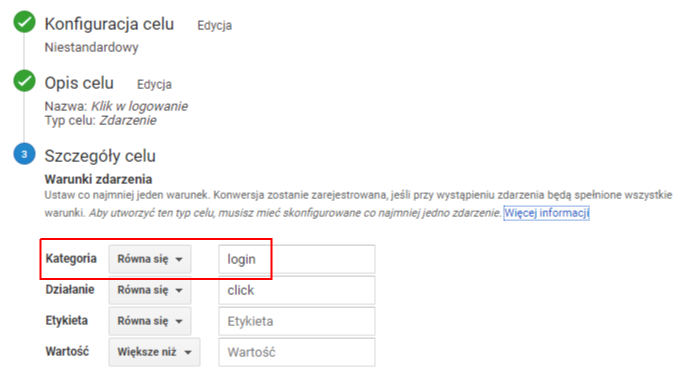
In the picture above you can see the settings of an event goal recording the clicking on the "Log in" button. I distinguished the name of the category of this event. No other goal has a category with this name in my Analytics, so I can use that as a unique feature. See what I do with it now.

Go to report Behaviour > Site content > All pages. Click +Add segment > Click +NEW SEGMENT
From the column of conditions on the left, I select Advanced > Conditions and in the middle part I choose Filter - Sessions - Include > from the drop-down list I select a unique part of my event (in my example it is Event category) and enter the text that it contains (in my case: 'login').
I name the segment and save it.
Yuppi!
Remember that you can also make the opposite segment for only not logged in users. Just remember to select "Exclude" instead of "Include" in the configuration.
So, now you can see what the number of these logging in users is, what pages they visit, how long it takes and whether they convert (i.e. achieve the goals you have created) or not.
Remember: In the same way, you can create a segment of people who have completed another event relevant to your analysis, such as watching a video or sending a form. It is enough for your Analytics reports to include data with a unique category or action for this event.
5. Blog readers segment for checking conversions
In addition to the sales pages of individual courses, Monika also runs a blog about learning Norwegian, where she publishes articles with valuable information for her (potential) students. She enjoys sharing knowledge, but she is known to live off learning for money, so she is curious how many people who enter her blog site also visit the course pages and how much they engage in (session time, exit pages). If your situation is similar, then this segment will be of great help to you.

Go to report Behaviour > Site content > All pages. Click +Add segment > Click +NEW SEGMENT
From the column of condition on the left, choose Advanced > Conditions, and in the middle, select Filter - Sessions - Include. Then select Entry page - contains - enter here an element of the address of your blog articles which is always added, e.g. post. Note that as you enter this word, Analytics will suggest full addresses that contain the word. This only means that Analytics has recently collected data from these websites and will confirm that you are entering the correct word without misspeeling (sic!).
While using this segment Monika noticed that although the articles are very popular, their readers do not go to the course pages. "Well, maybe they don't know how to get there?" she thought at some point and decided to build in the blog pages CTA (call-to-action) buttons redirecting users to the course offer. And what can you improve on your website? 😊
6. Abandoned cart segment from e-commerce reports
Store owners especially like this segment as it is also the basis for creating an audience list for a remarketing campaign. It is created very easily, directly in the e-commerce report.

Go to Conversions > E-commerce > Shopping behaviour
Click on the "Cart Abandonment" tile under the "Sessions with Add to Cart" column. Create a new segment. You can use the default name "Cart Abandonment" or make your own, select whether the segment should be available only in the current data view or in the entire Analytics property, and click "Create Segment".
Monika watches carefully if her potential students do not leave the shopping cart too often, because this could mean that at the stage of placing the order, something is unclear for them or simply does not work. She is also considering launching paid campaigns in Google Ads, in which case she can use the shopping cart abandonment segment as a basis for creating an audience list.
If you don't know what remarketing is, you will soon find it in another article: What is remarketing, how to turn it on and how to use it, or a tag for people with strong nerves (so far it is available in Polish only here). Also, if you are interested in the audence lists and how to configure them, an English version of the article Everything you always wanted to know about remarketing lists but were afraid to ask will be available soon (you can find Polish version here).
If you want to know when they are published, sign up to Strefa Analityki and you will be informed about all new publications on the Knowledge Base pages.
Finally, a handful of practical information on what can be done with the segments.
1. Comparing data in reports
We use segments in most Universal Analytics reports. Just click on + Add segment in the upper part of the report to open a table with a list of those already available and the option to create new segments.
Remember that you can use up to four segments at the same time.
Each segment gets its color on the chart and thanks to it you will not get lost when looking at the lines passing through each other.
Segments follow you through your reports until you turn them off (arrow down > Remove) or exit Analytics.
2. Sharing segments
You can share segments with other people. Go to Administration > View > Segments. Click on the three dots to the right of the selected segment and choose "Share". Then a window with a link to copy will appear. You send a link to whomever you want by e-mail or any messenger.
Note: This way, you only share the segment configuration, not your Analytics data 😊
3. Availability of segments in your account
When editing a segment, you can choose its availability in your account. There are three options:
I can apply / edit the segment in any view of the data (and therefore also in other Analytics properties of the Google account).
I can apply / edit a segment in this data view.
Collaborators and I can apply / edit a segment in this data view.
You can change the availability multiple times.
4. Editing segments
By entering from Admin or from reports, you can edit each segment setting. They can also be copied, which makes it easier to change one element of a complex condition in another, similar segment.
What is worth remembering? Give your segments names that are easy to read for you. It always comes in handy.
Besides
We discuss and practice all these possibilities for Universal Analytics and GA4 in the Google Analytics course from scratch - if you want to learn more or save, check it out here.
Additional articles (click to go):
Google: About segments
Google: Segment MCF conversion-path data
Baza wiedzy: Why my audience is the Persona?
Videotutorial (youtube.com, channel Owwwla - Google Analytics od podstaw, Polish sound):
If you have questions or topics that are not covered here, and you are particularly interested in, write to me, I will be happy to help.
Owwwla


Comments